STORIES OF IMPACT
/
White Papers / Banking Performance 4Q20
Banking Performance 4Q20
Executive Summary: Four Key Themes
1) Growth in digital banking. Technology at the mega-banks has transformed their customer experience and shifted consumer and business transaction volume to digital and mobile channels. This transformation was accelerated by the pandemic and forces other banks to invest in digital banking. Community banks need to develop a digital strategy ASAP.
2) Dramatic reduction in many banks’ consumer fee income. The pandemic changed consumer spending and payment patterns. As consumers moved to contactless payments, check, cash, and ATM volume fell; person- to-person or person-to-business (P2P or P2B) rose. ACH transactions also rose. These payment channels generate lower deposit service fees. Lower consumer spending and shifts toward low interchange categories reduced card fees. At the mega-banks, these fee categories are buried among others (fee income is often as much as net interest margin), but at community banks, deposit service fees and card fees are critical. Loss of this income is pressuring regional and community banks to pursue additional sources of fee income such as mortgage origination.
3) Determining the right loss allowance. Loss provisioning is always difficult, but the pandemic made it impossible. Most banks boosted provisions for 1Q and 2Q, and then reversed some of this provision by 4Q – before we have enough data about how loan portfolios will actually perform. The result is even larger than normal variation in loss allowance across banks. At this juncture, it is important for community banks to stress test their portfolios and develop contingency plans for loans that may wind up in workout. Some are likely to outsource this activity.
4) Deferral and loan modification activity. Banks seek public relations benefits by highlighting their actions (like deferrals) that help customers through the pandemic. At the same time, they demonstrate that deferral activity is infrequent and unlikely to have a material impact on credit quality. That’s right, having your cake and eating it too. Other borrower-friendly activities like modifications have largely gone unreported – though modifications are having an even bigger impact on performance. When these modifications must be reported as troubled debt restructurings (and hence largely cease), what will happen to delinquency performance?
The Rise of Digital
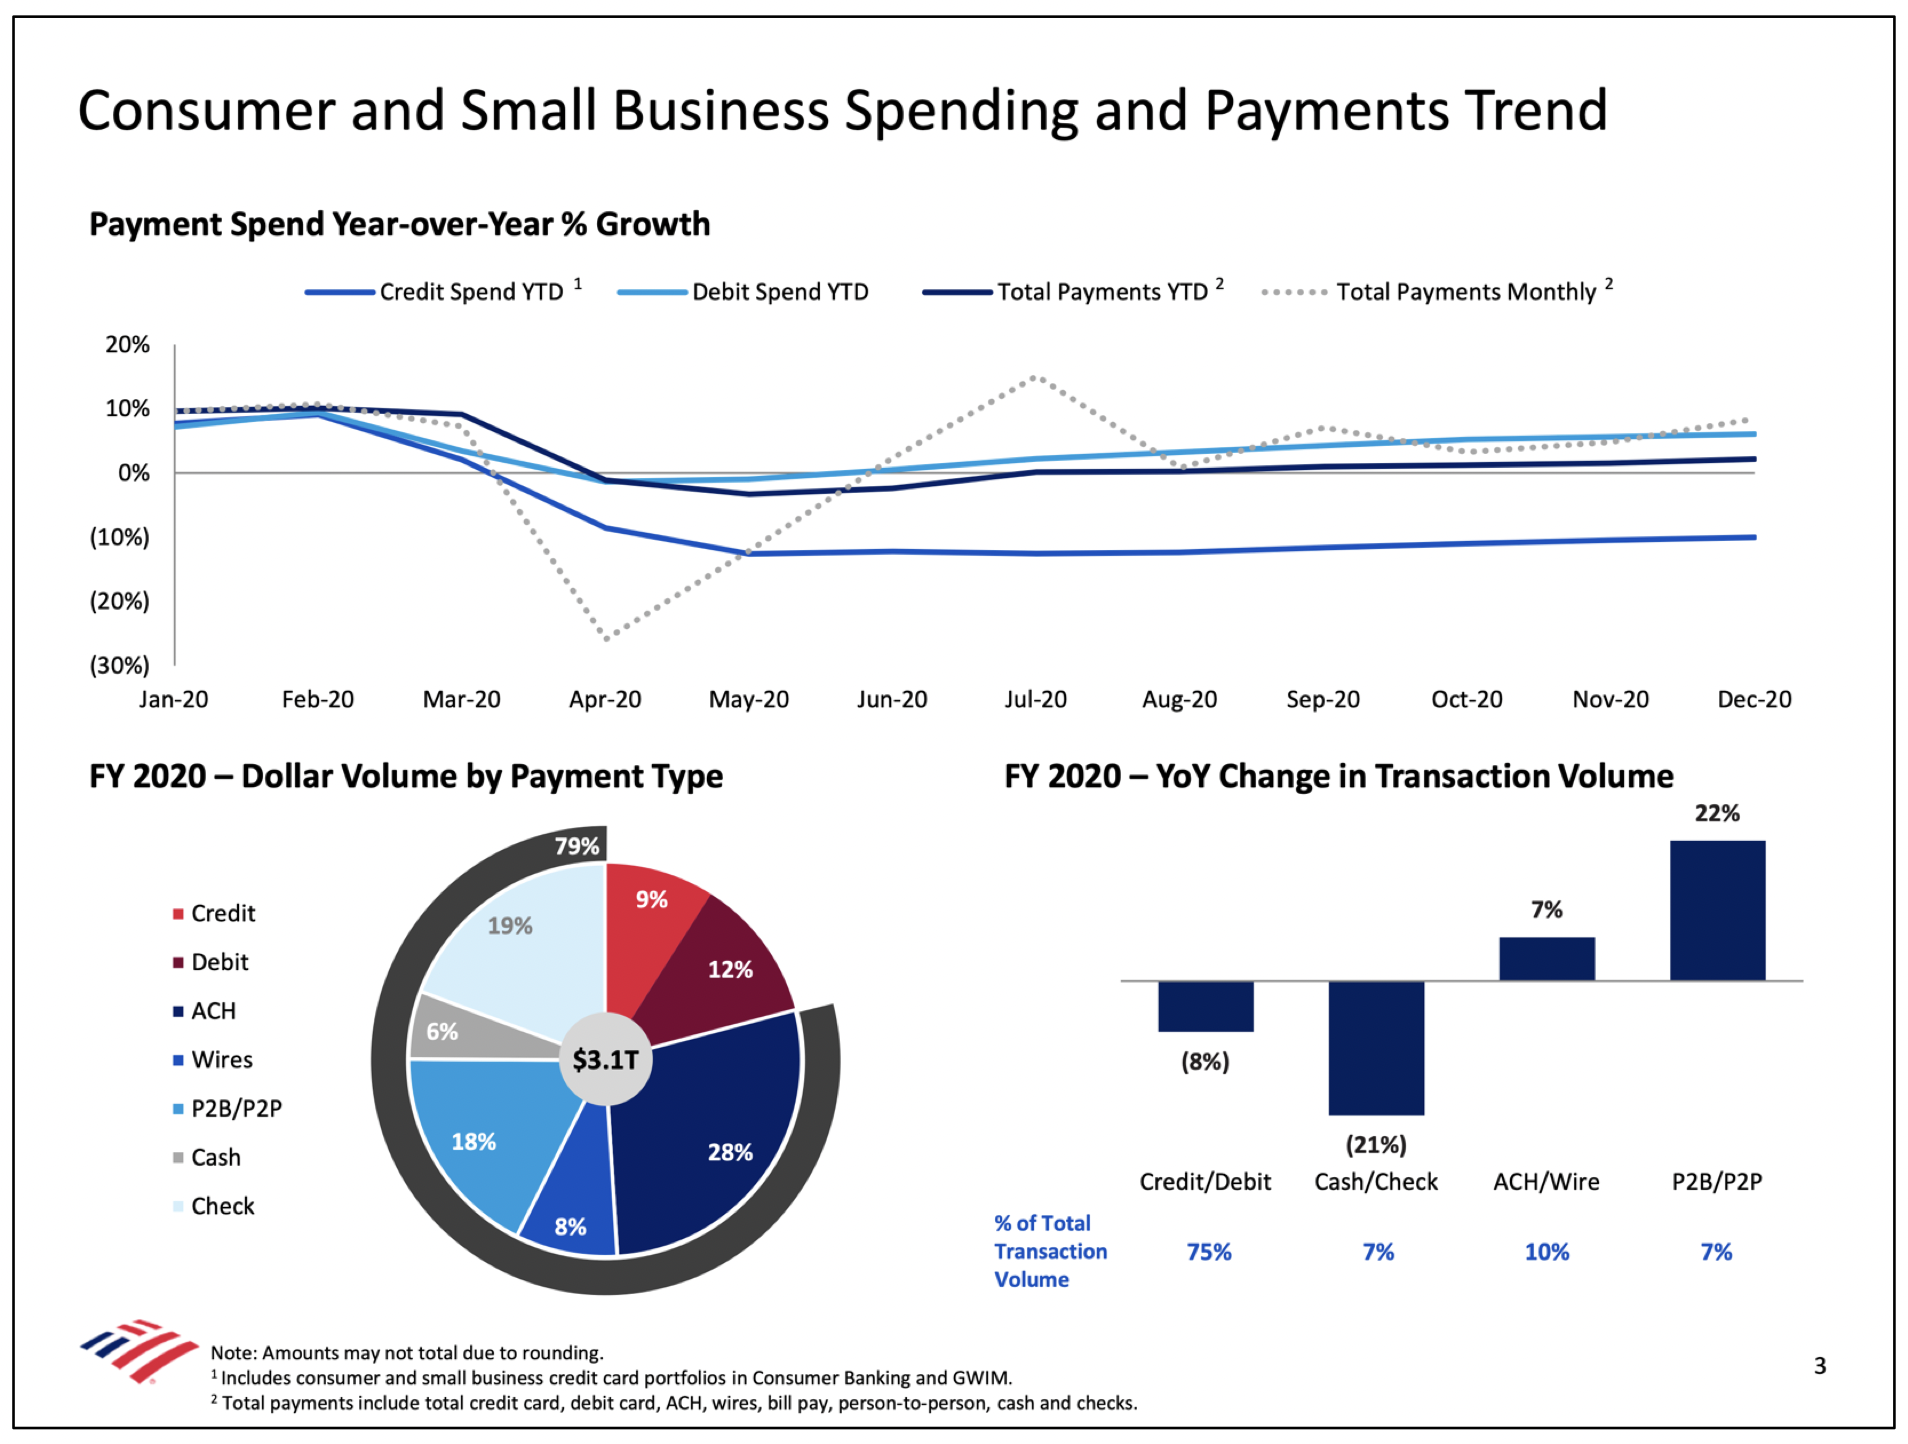
BofA’s digital payments (18%) are fast approaching check (19%) and card payments (21%), as shown in the pie chart below. The pandemic accelerated changes to consumer payment preferences. Remote payment transaction volume, whether online or mobile and whether P2B or P2P, jumped 22% year-over-year, whereas cash and check payments fell 21%. Other banks do not disclose data on payments by type but appear to match or exceed BofA. Chase’s technology spend is about $5B -- half of non-interest expense-investments (page 14), and digital engagement is at 69% for consumer banking and 86% for business banking (page 18).
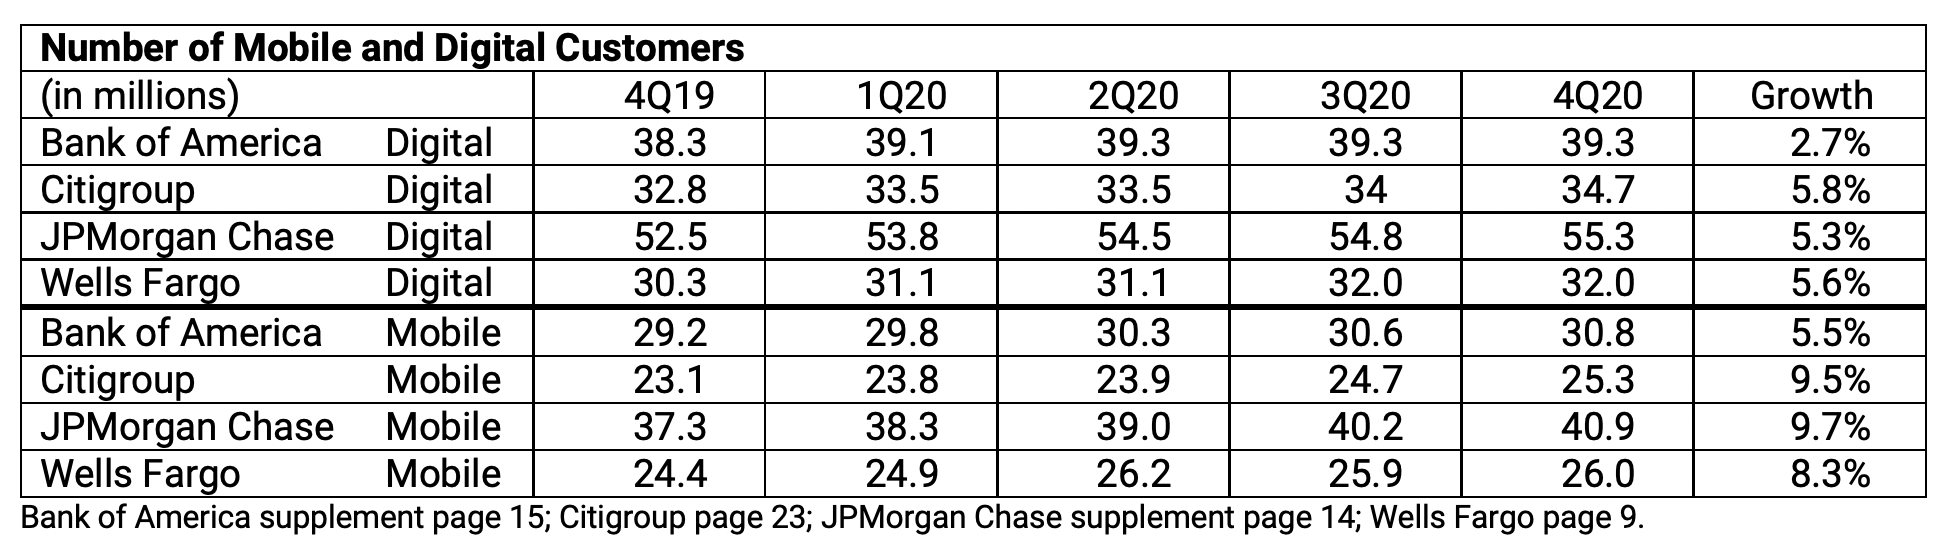
Digital and mobile customer growth continues, albeit at slower rates than transactions. As shown in the table on the next page, the number of digital and mobile customers show modest increases in 2020, but this doesn’t tell the whole story. Digital and mobile transaction activity (the pie above) is up far more.
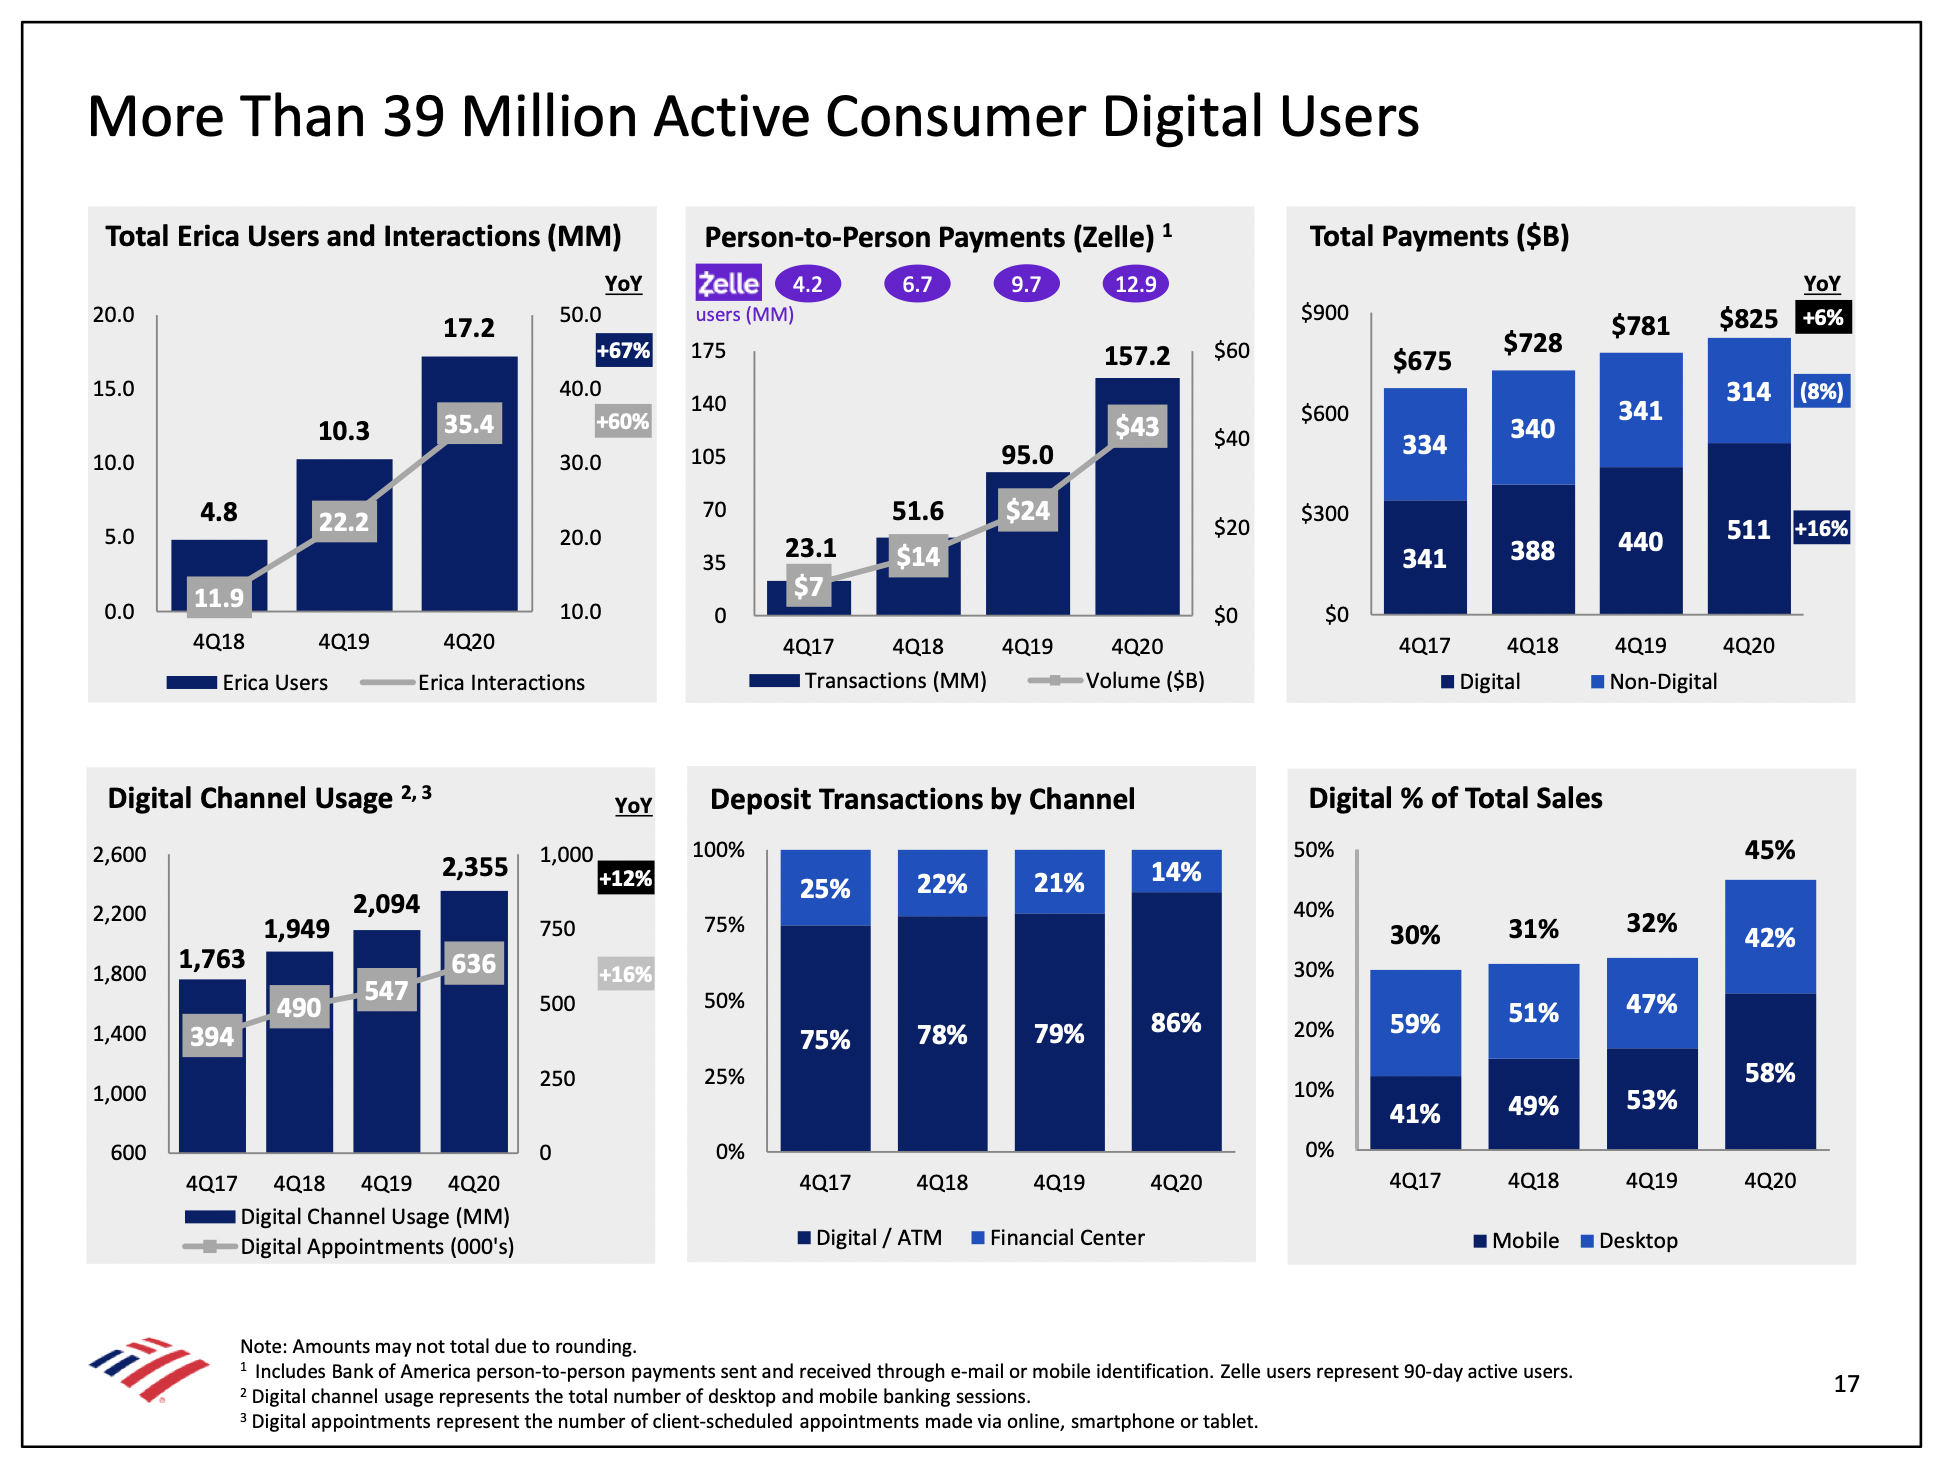
The following graphics show how Bank of America describes its digital banking activity.
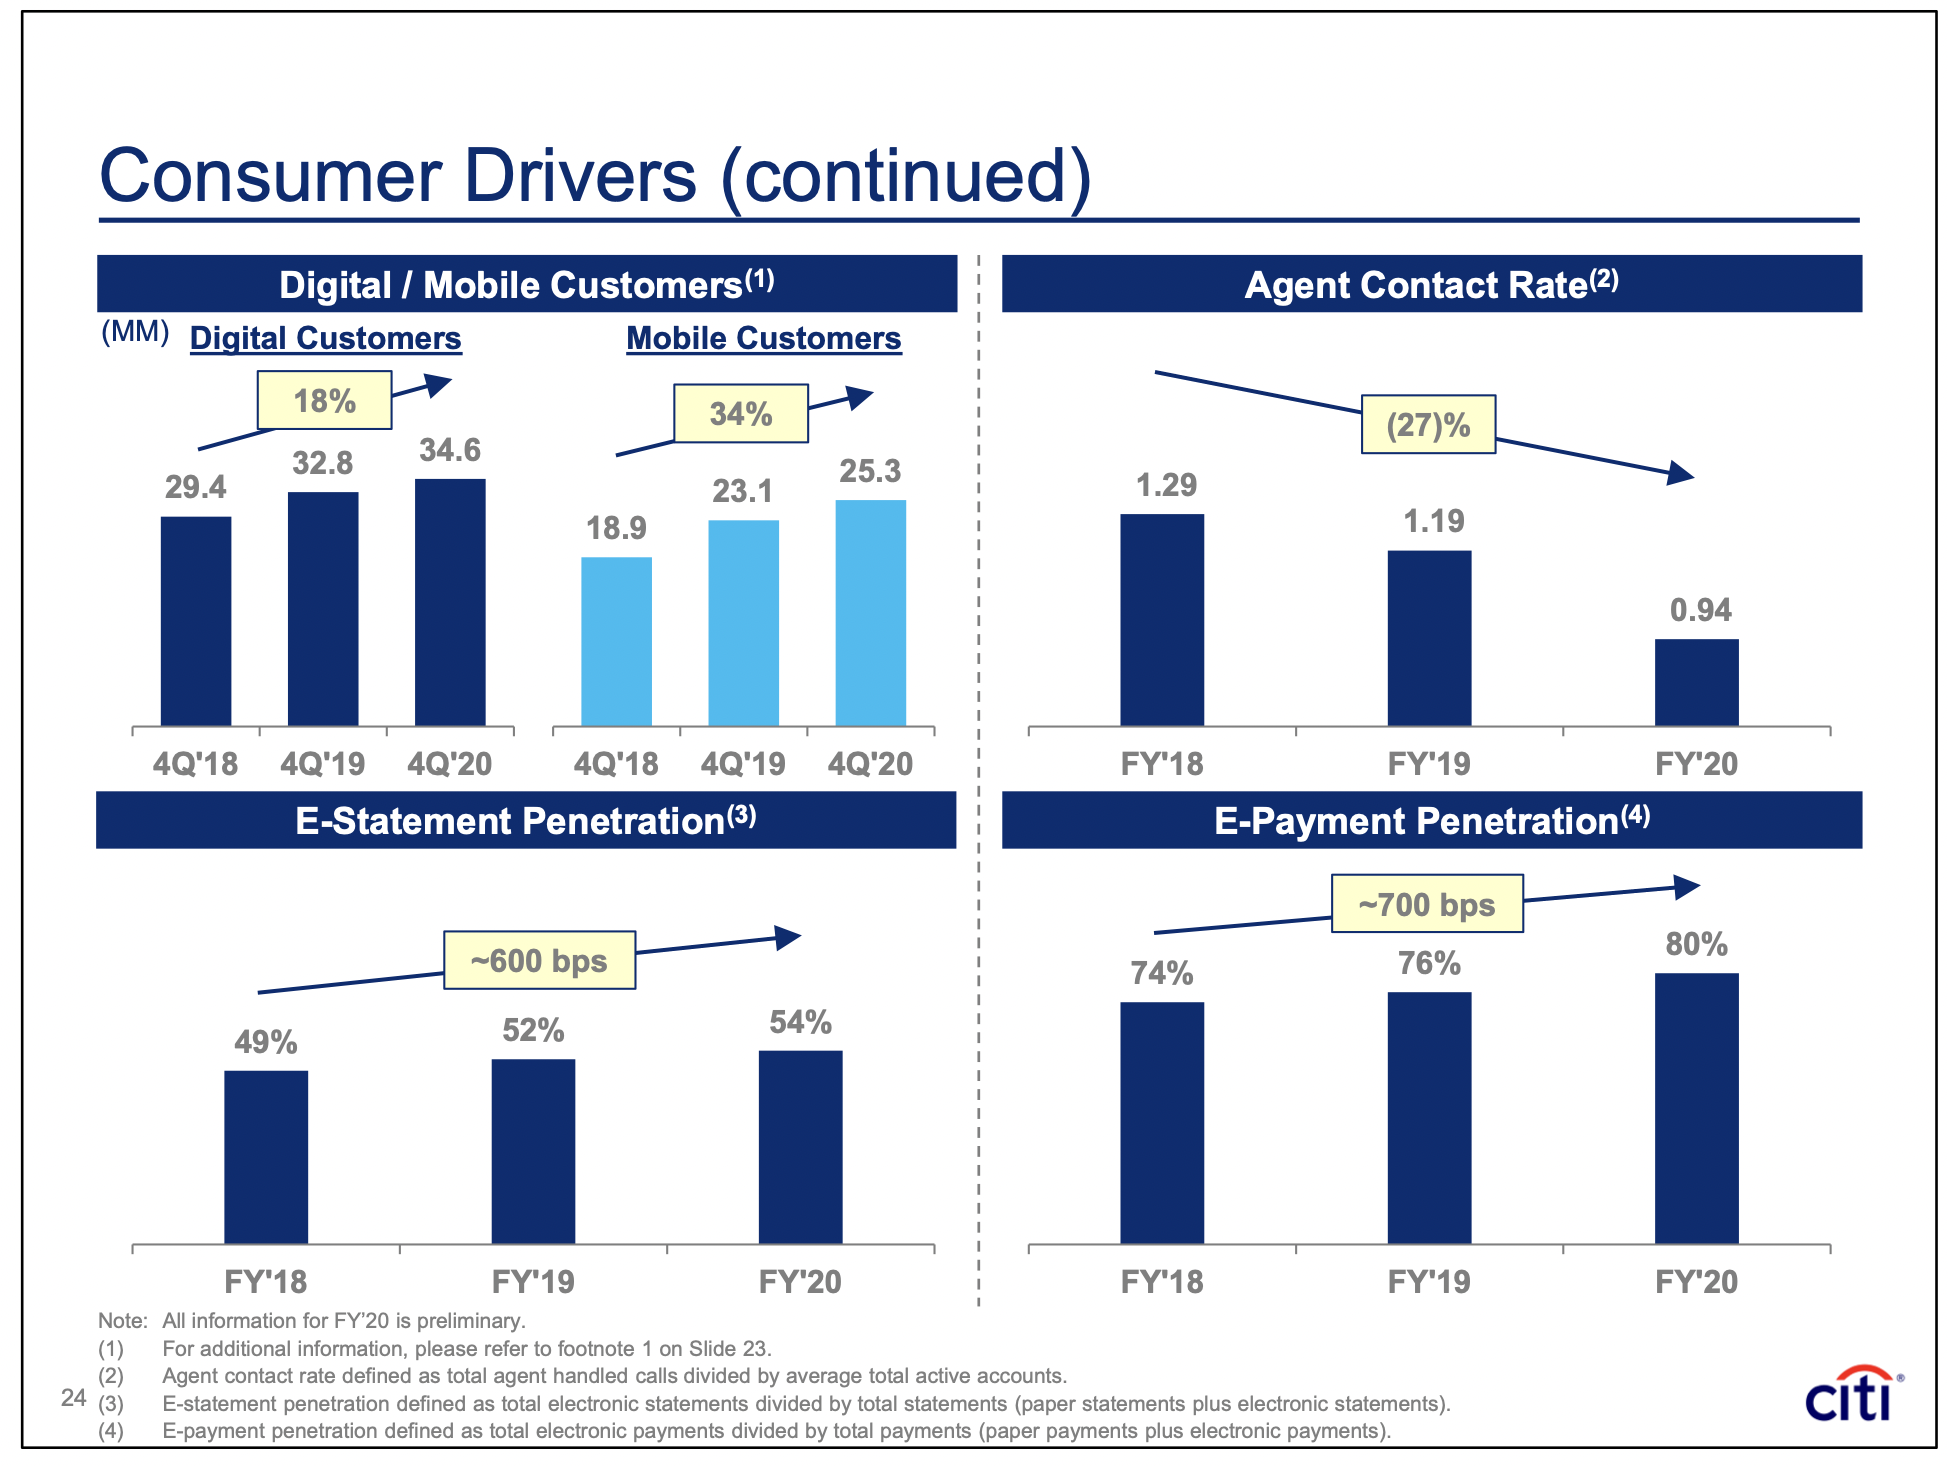
Even Citigroup, which normally focuses on performance by geography and other macro drivers, presents data about the shift in consumer preference towards digital banking as shown in the graphic below.
Reduced Fee Income
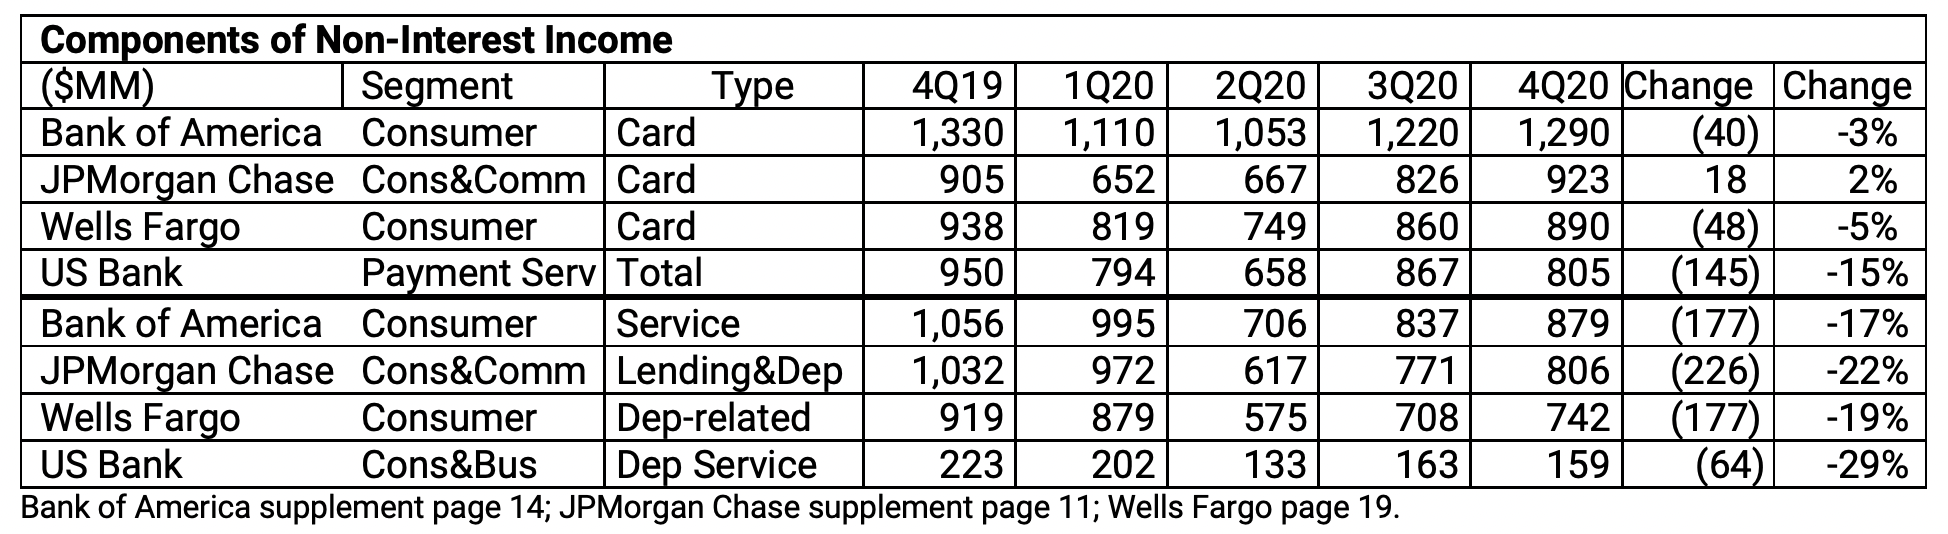
Key sources of fee income are falling as consumer spending falls and shifts to other channels. The mega- banks have the luxury of diverse sources of fee income (e.g. investment banking, trading, and asset management) that community and regional banks do not, so fees often match net interest margin. Key sources of fee income for these banks are deposit service fees and card services. These categories fell during 2020 – about 20% for deposit fees and 3-5% for card fees – as shown in the table below.
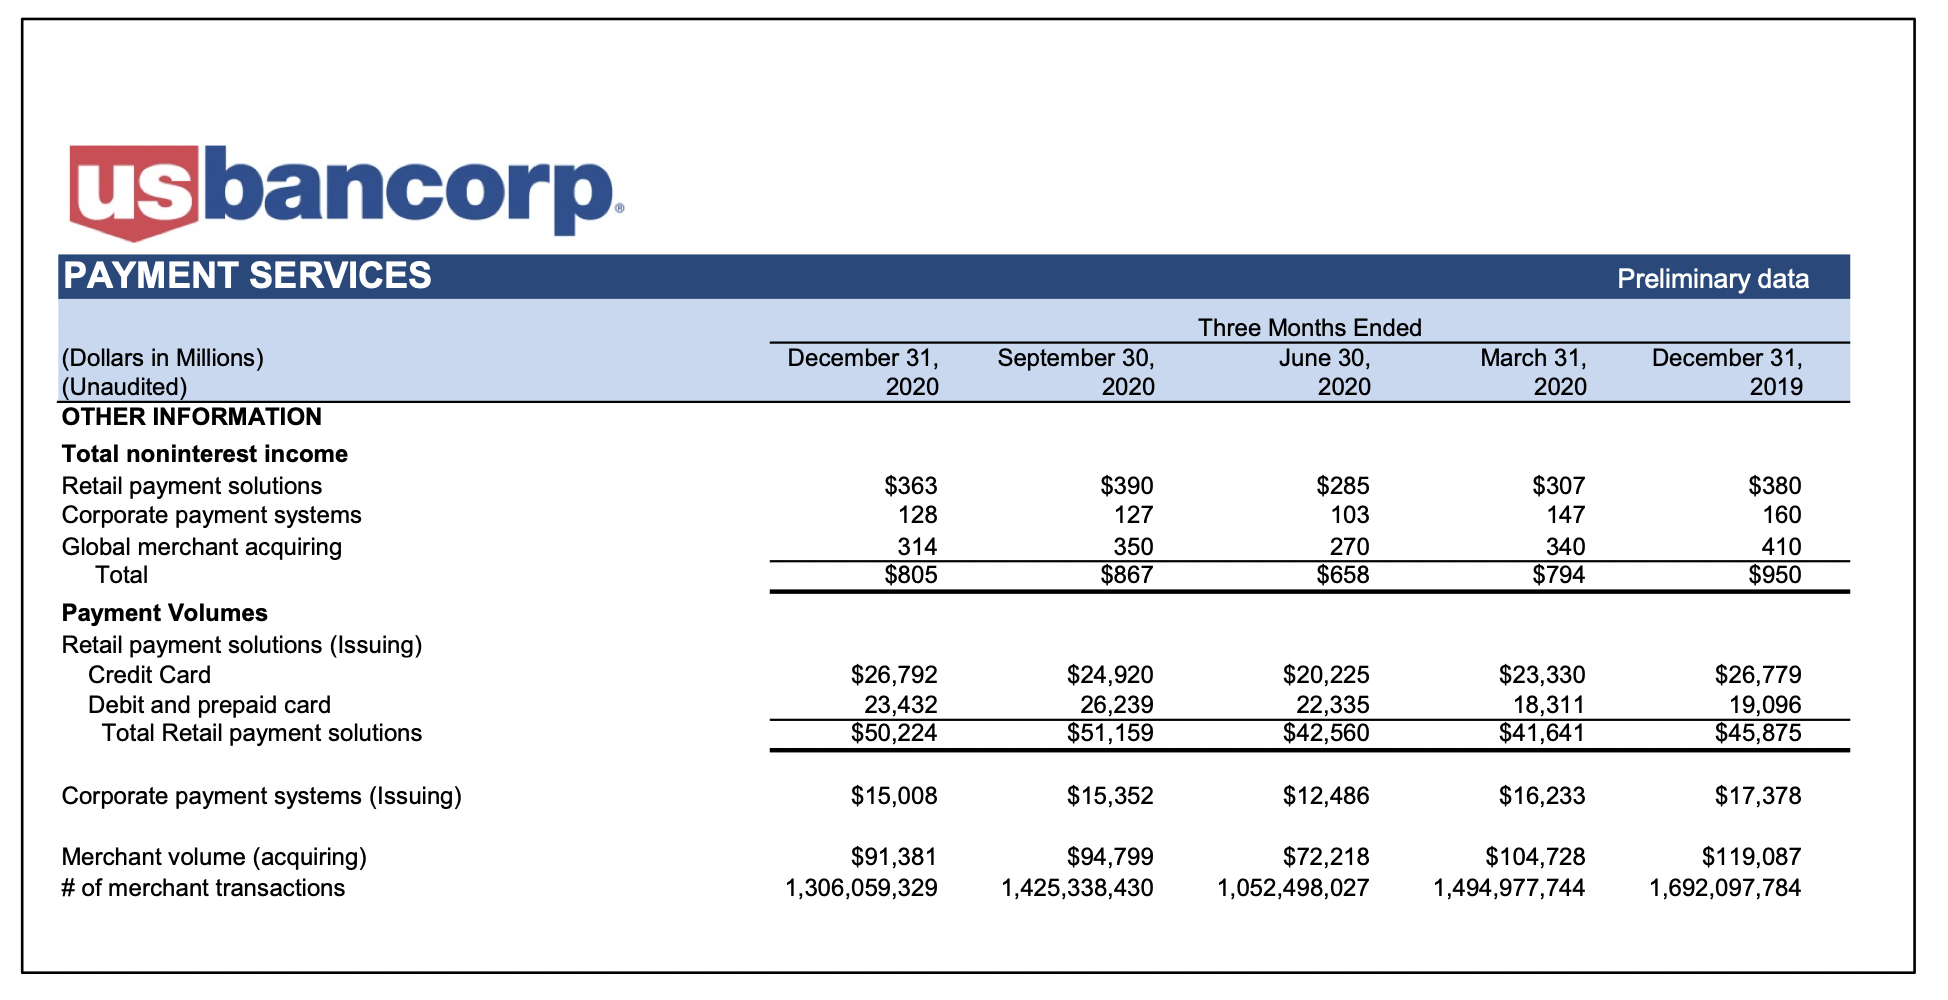
These fee categories are critical for most community banks, even though they gain scant attention diversified banks. At US Bank, however, Payment Services is reported as a separate segment and its non-interest income fell from $950 million 4Q19 to $658 million 2Q20 (-31%) before recovering to $805 million 4Q20 (-15%). That’s enough to get everyone’s attention. The following slide shows non-interest income for US Bank’s Payment Services segment.
Pandemic-Related Loss Provision
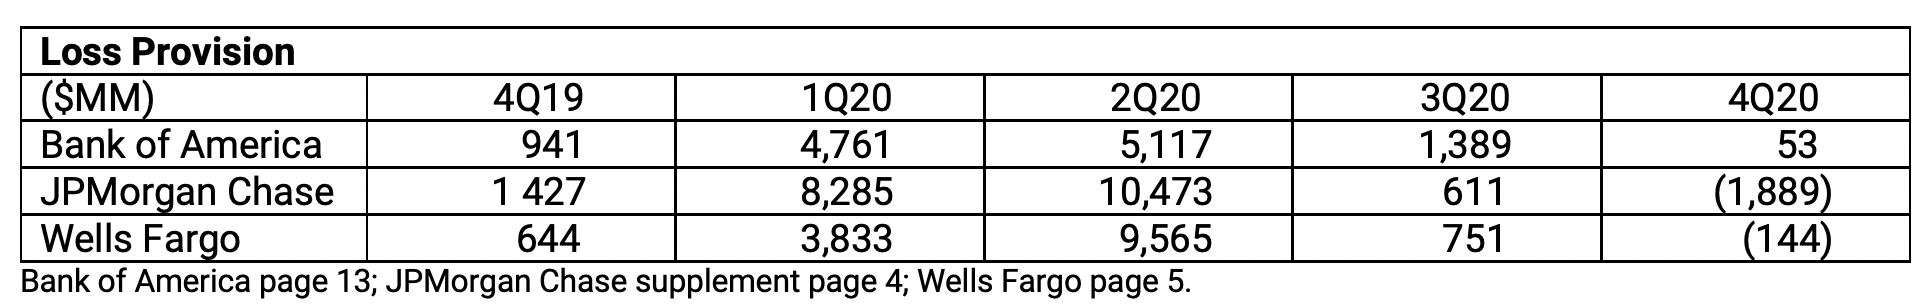
Most banks took large provisions in 1Q and 2Q but none in 4Q. When pandemic lockdowns started last March, most banks took a large provision (roughly 5x normal) for potential loan losses. As the year progressed into the second quarter, albeit with little information about the true credit performance of the portfolio, banks took an even larger provision. Provisions fell back to normal in 3Q and then none or negative for 4Q as shown in the table below.
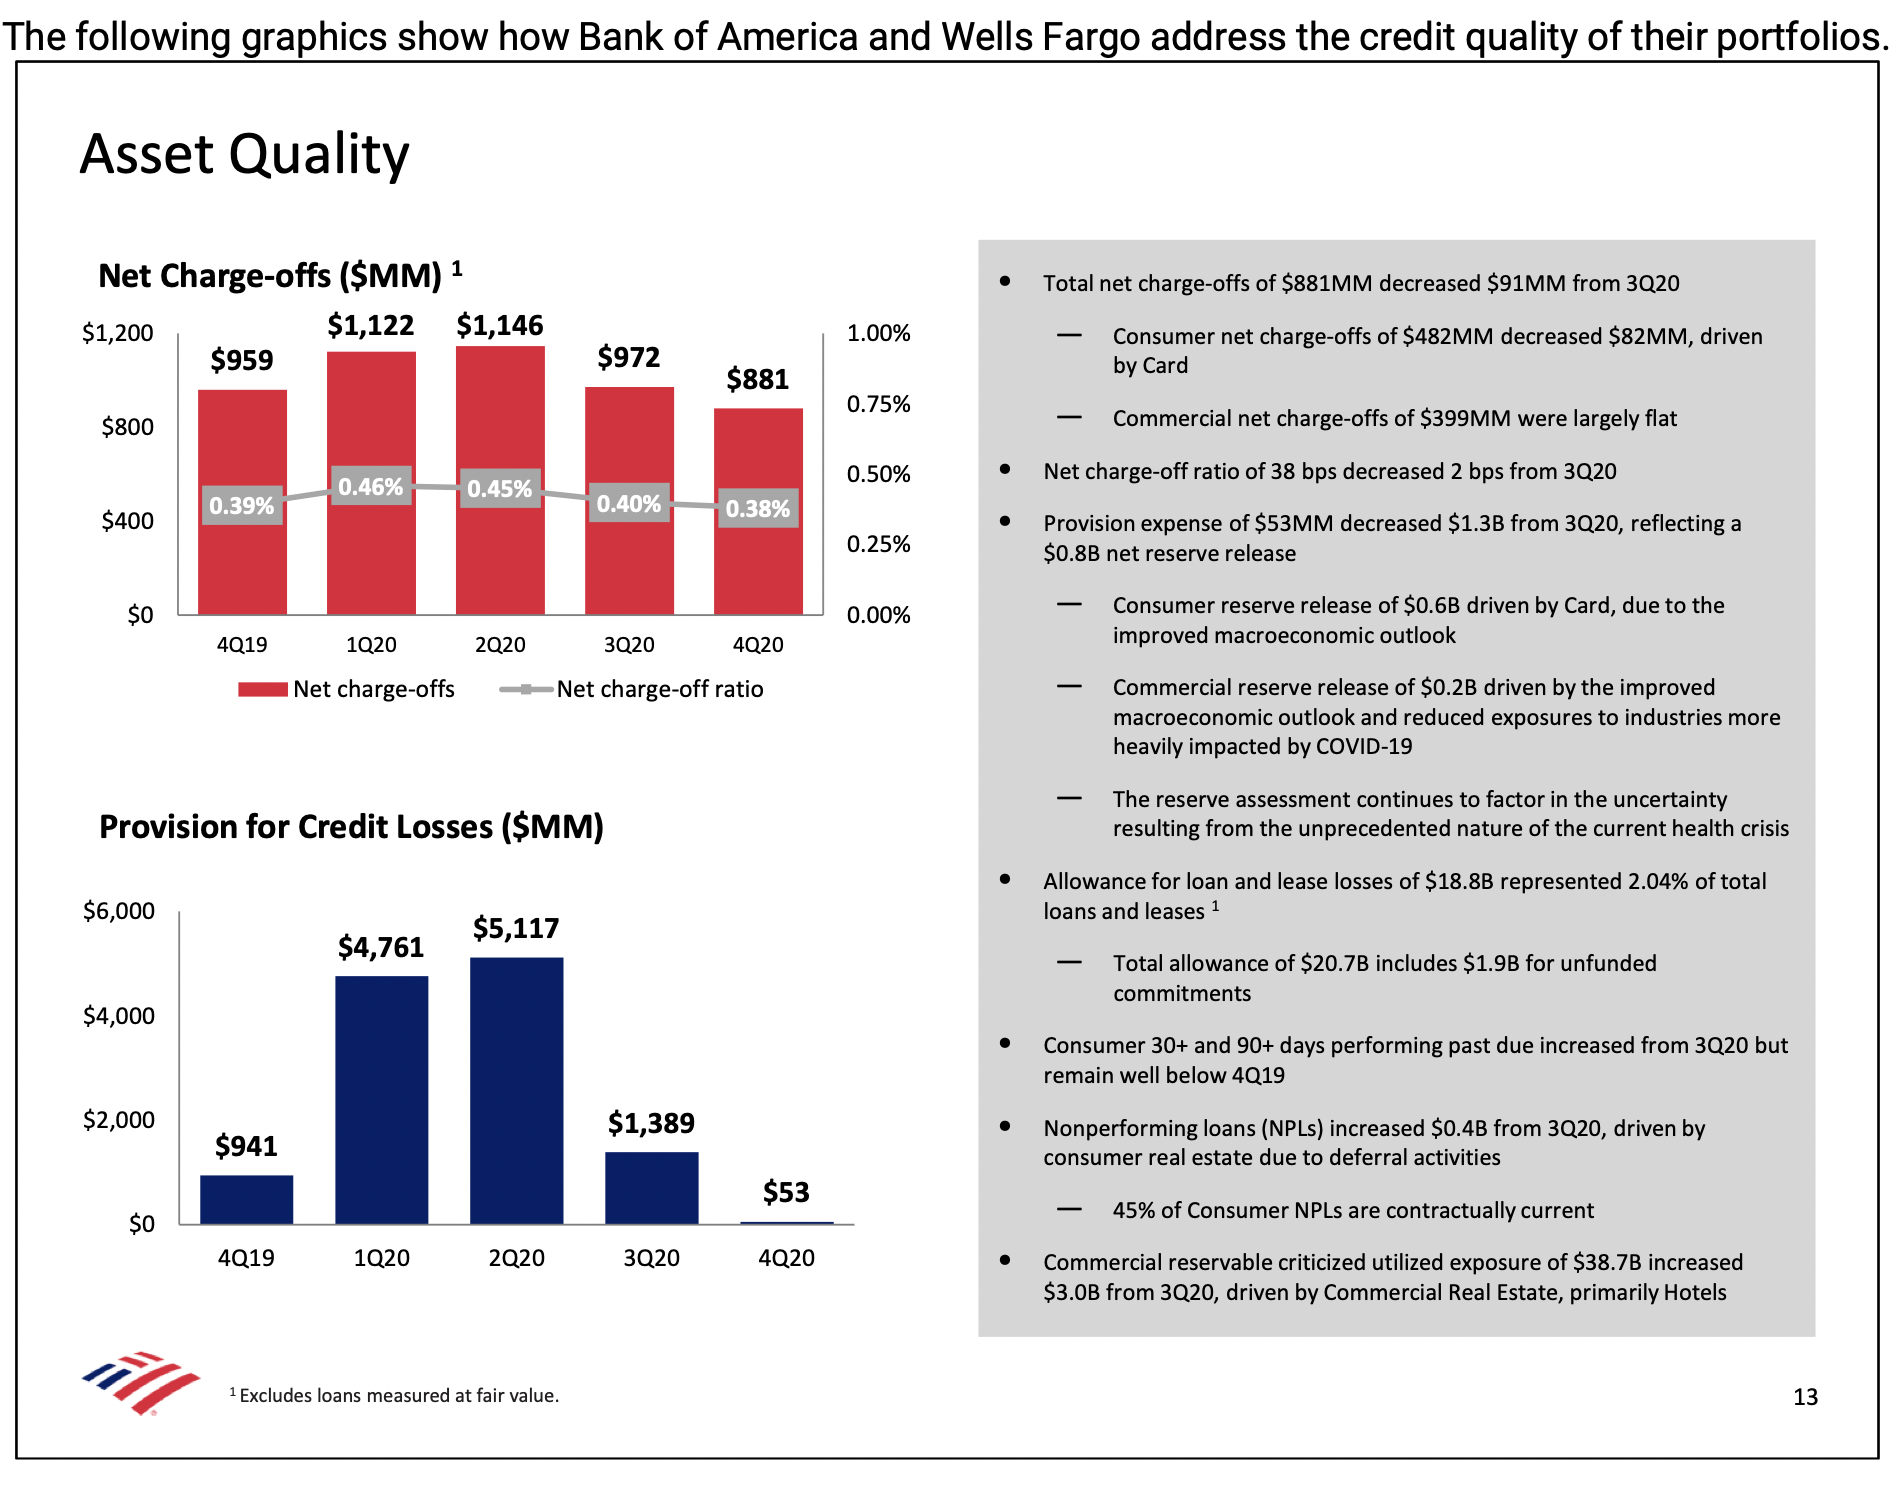
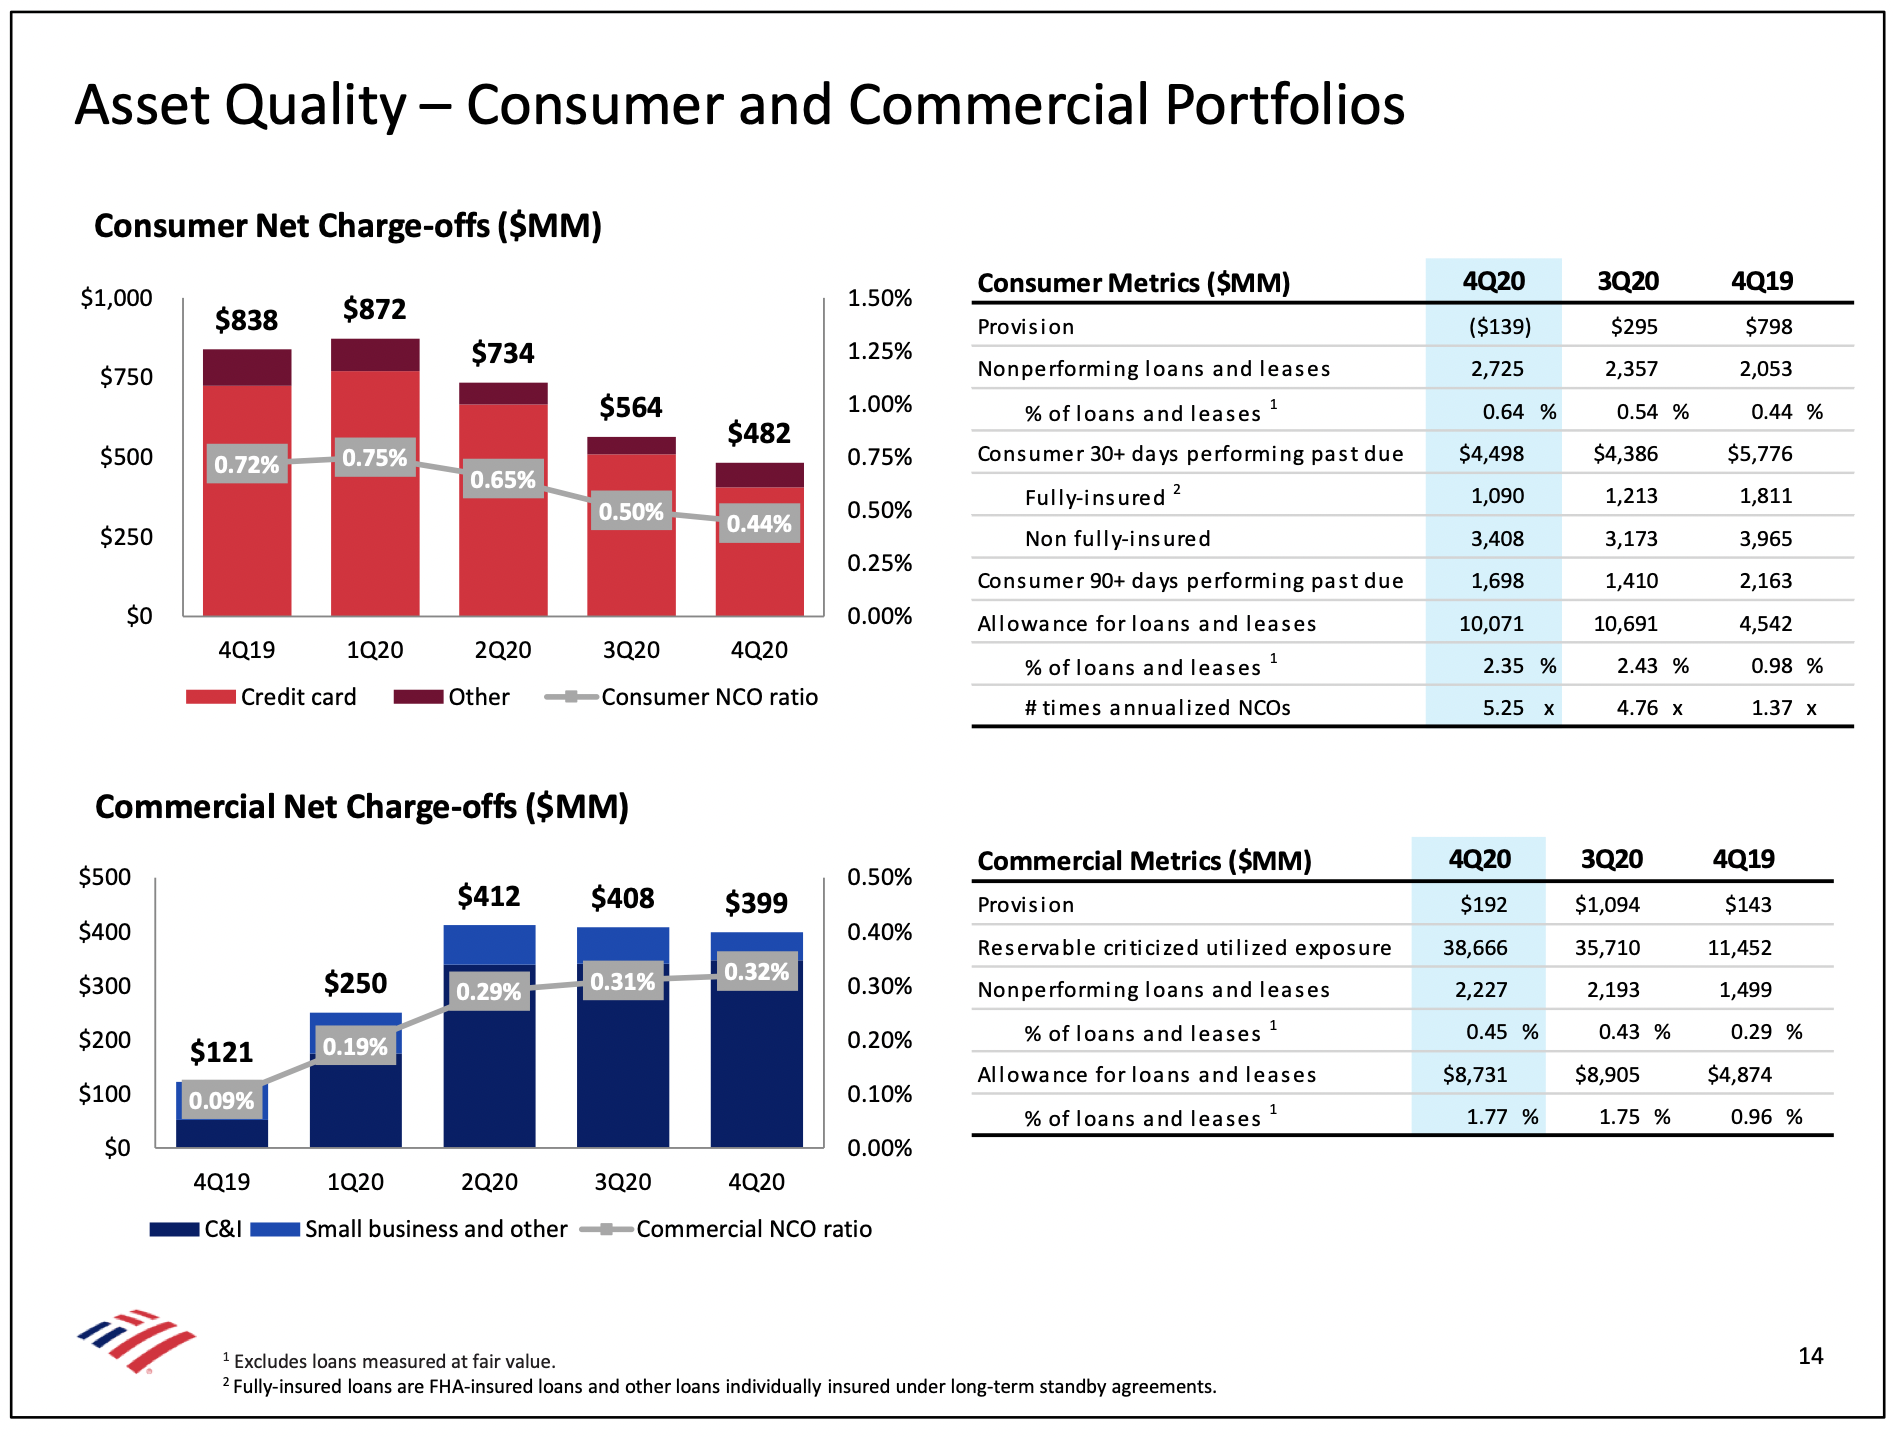
Changes to banks’ loss reserves, while material, may not cover real exposure. Loss provision depends on total reserve needs at the end of the period and net charge-off activity during the period. Considering all of the government-sponsored forbearance activity, it isn’t surprising that charge-offs did not increase in 2020. In fact, consumer charge-offs actually dropped quarter-by-quarter as 2020 progressed (see red bars in BofA example in the slide on the next page). BofA says, “Credit card delinquencies declined in March through July, driven by loan deferrals and government stimulus.” That is, the bank didn’t take charge-offs; the borrower didn’t catch up on payments; delinquencies declined because of deferrals.
What will happen to credit performance in 2021? The most important credit questions right now are: What will happen to performance as the “pandemic economy” continues? Even worse, how will borrowers catch-up when deferrals end? Bank of America’s allowance on consumer loans rose from 0.98% as of 12/19 to 2.35% as of 12/20. So BofA increased its cushion by 1.37%. Is that enough? Too much? It’s impossible to know.
On the commercial side, the ALLL rose from 0.96% to 1.77% during 2020. Is that extra 0.81% going to be enough?
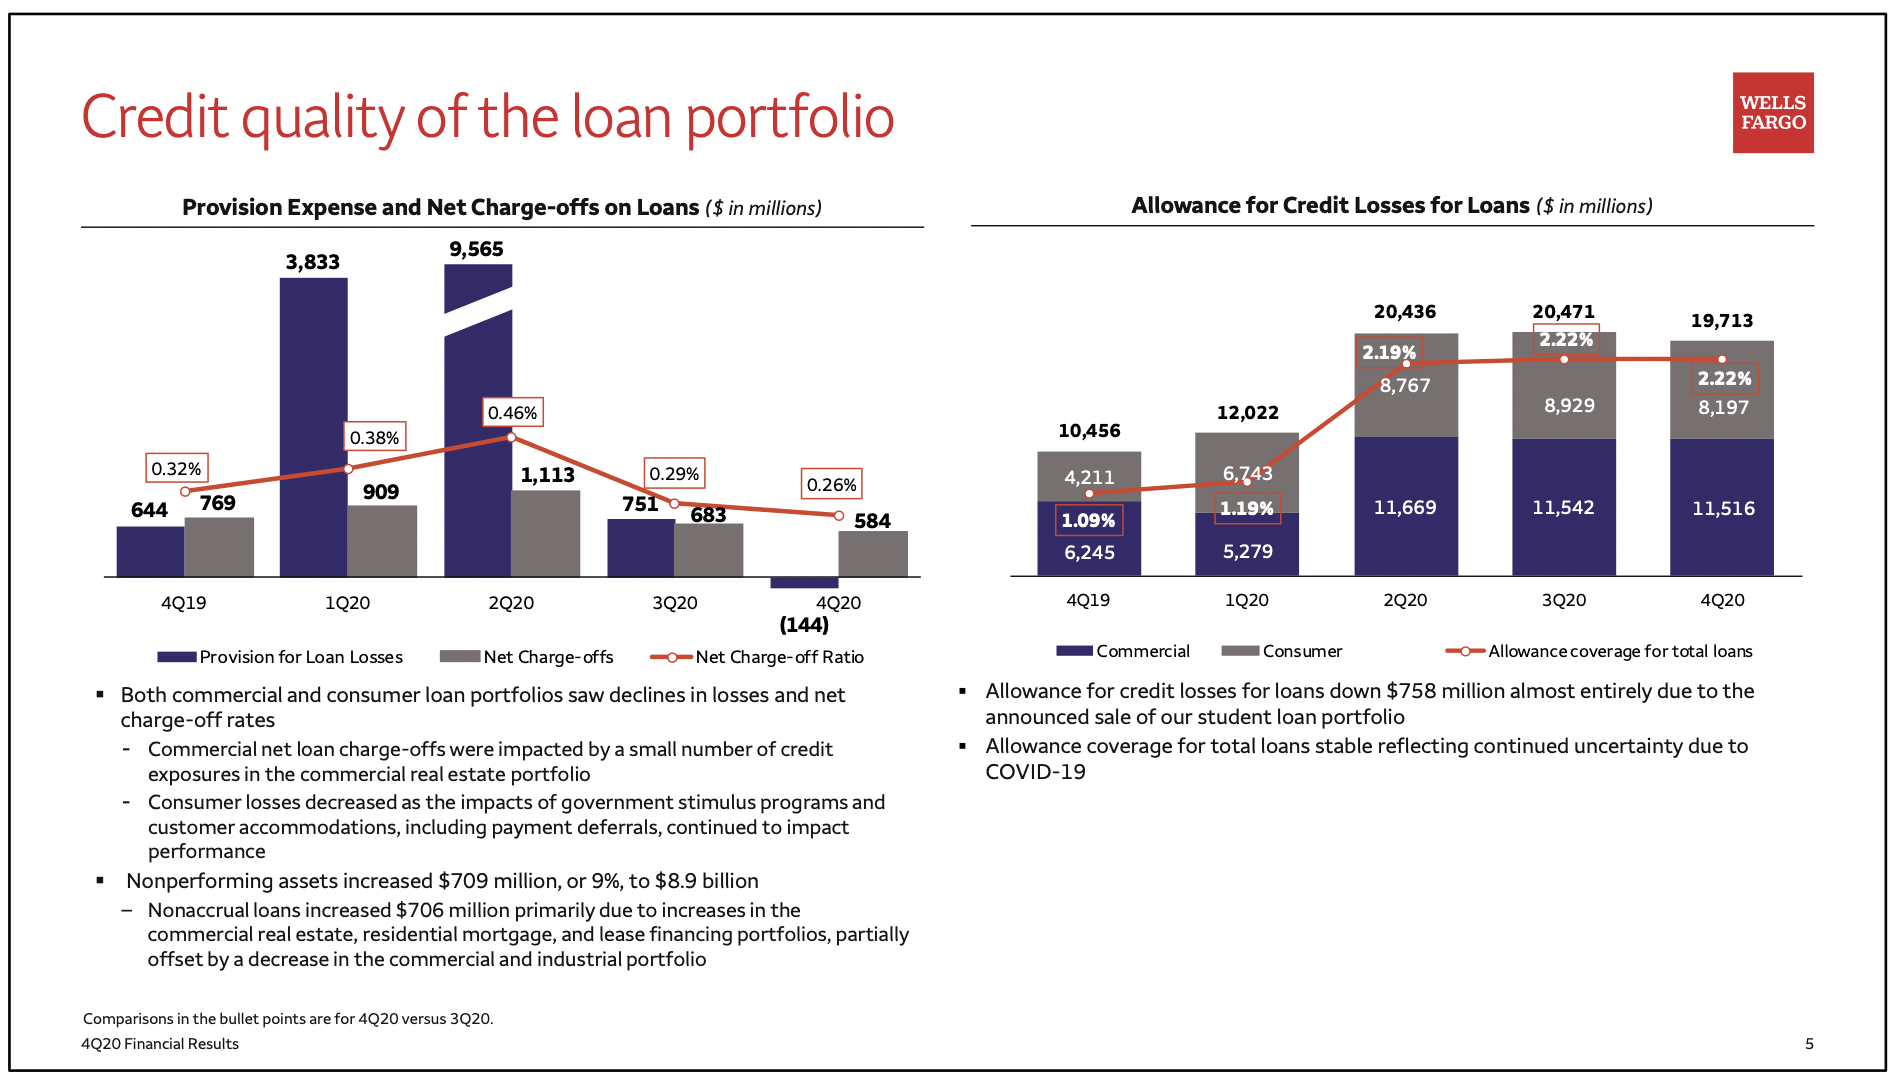
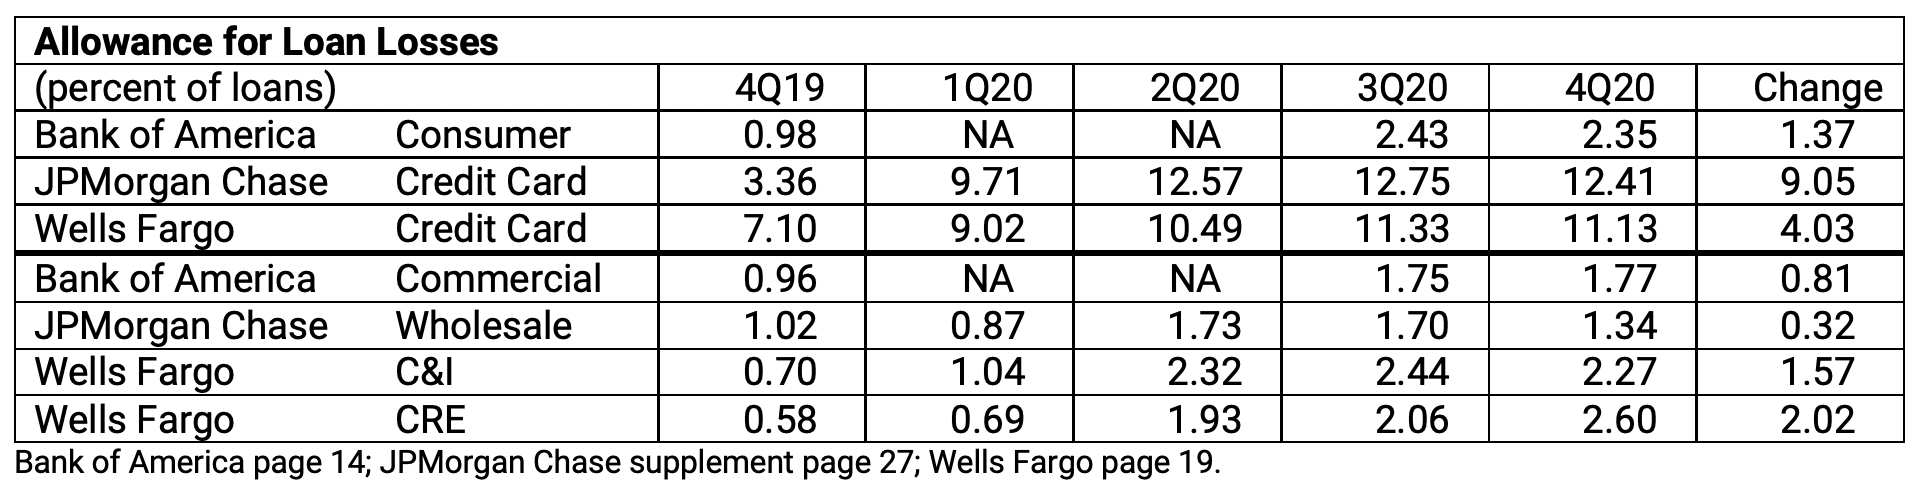
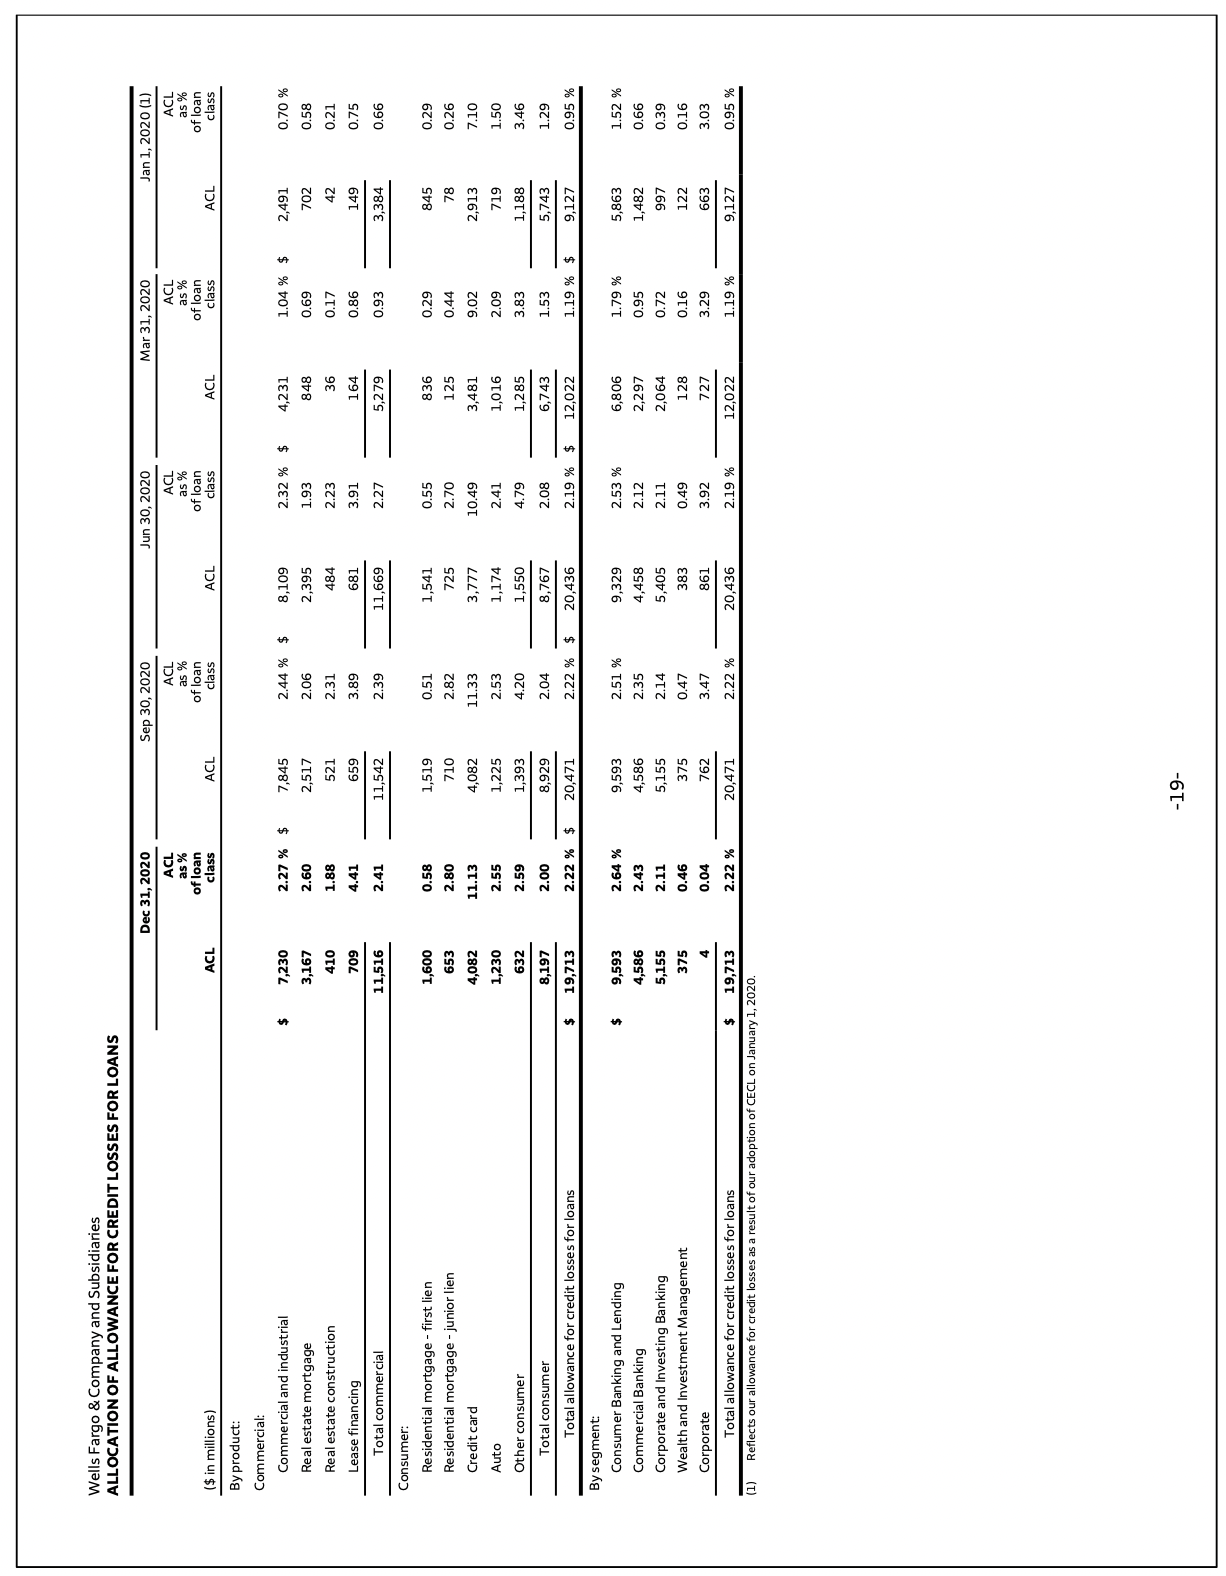
Enhanced granularity provides more comfort but can’t answer the enough/too much question. Wells does a good job of showing how its loss reserves are allocated across the portfolio (see the table below and the graphic on the next page). But it’s impossible to know whether its 11.13% for credit cards will be enough – now it’s less than Chase (which jumped 3x); or its 2.27% for C&I or 2.60% for CRE – Chase’s total wholesale loan allowance barely rose, so Wells looks great by comparison. Only time will tell which reserve is the right amount.
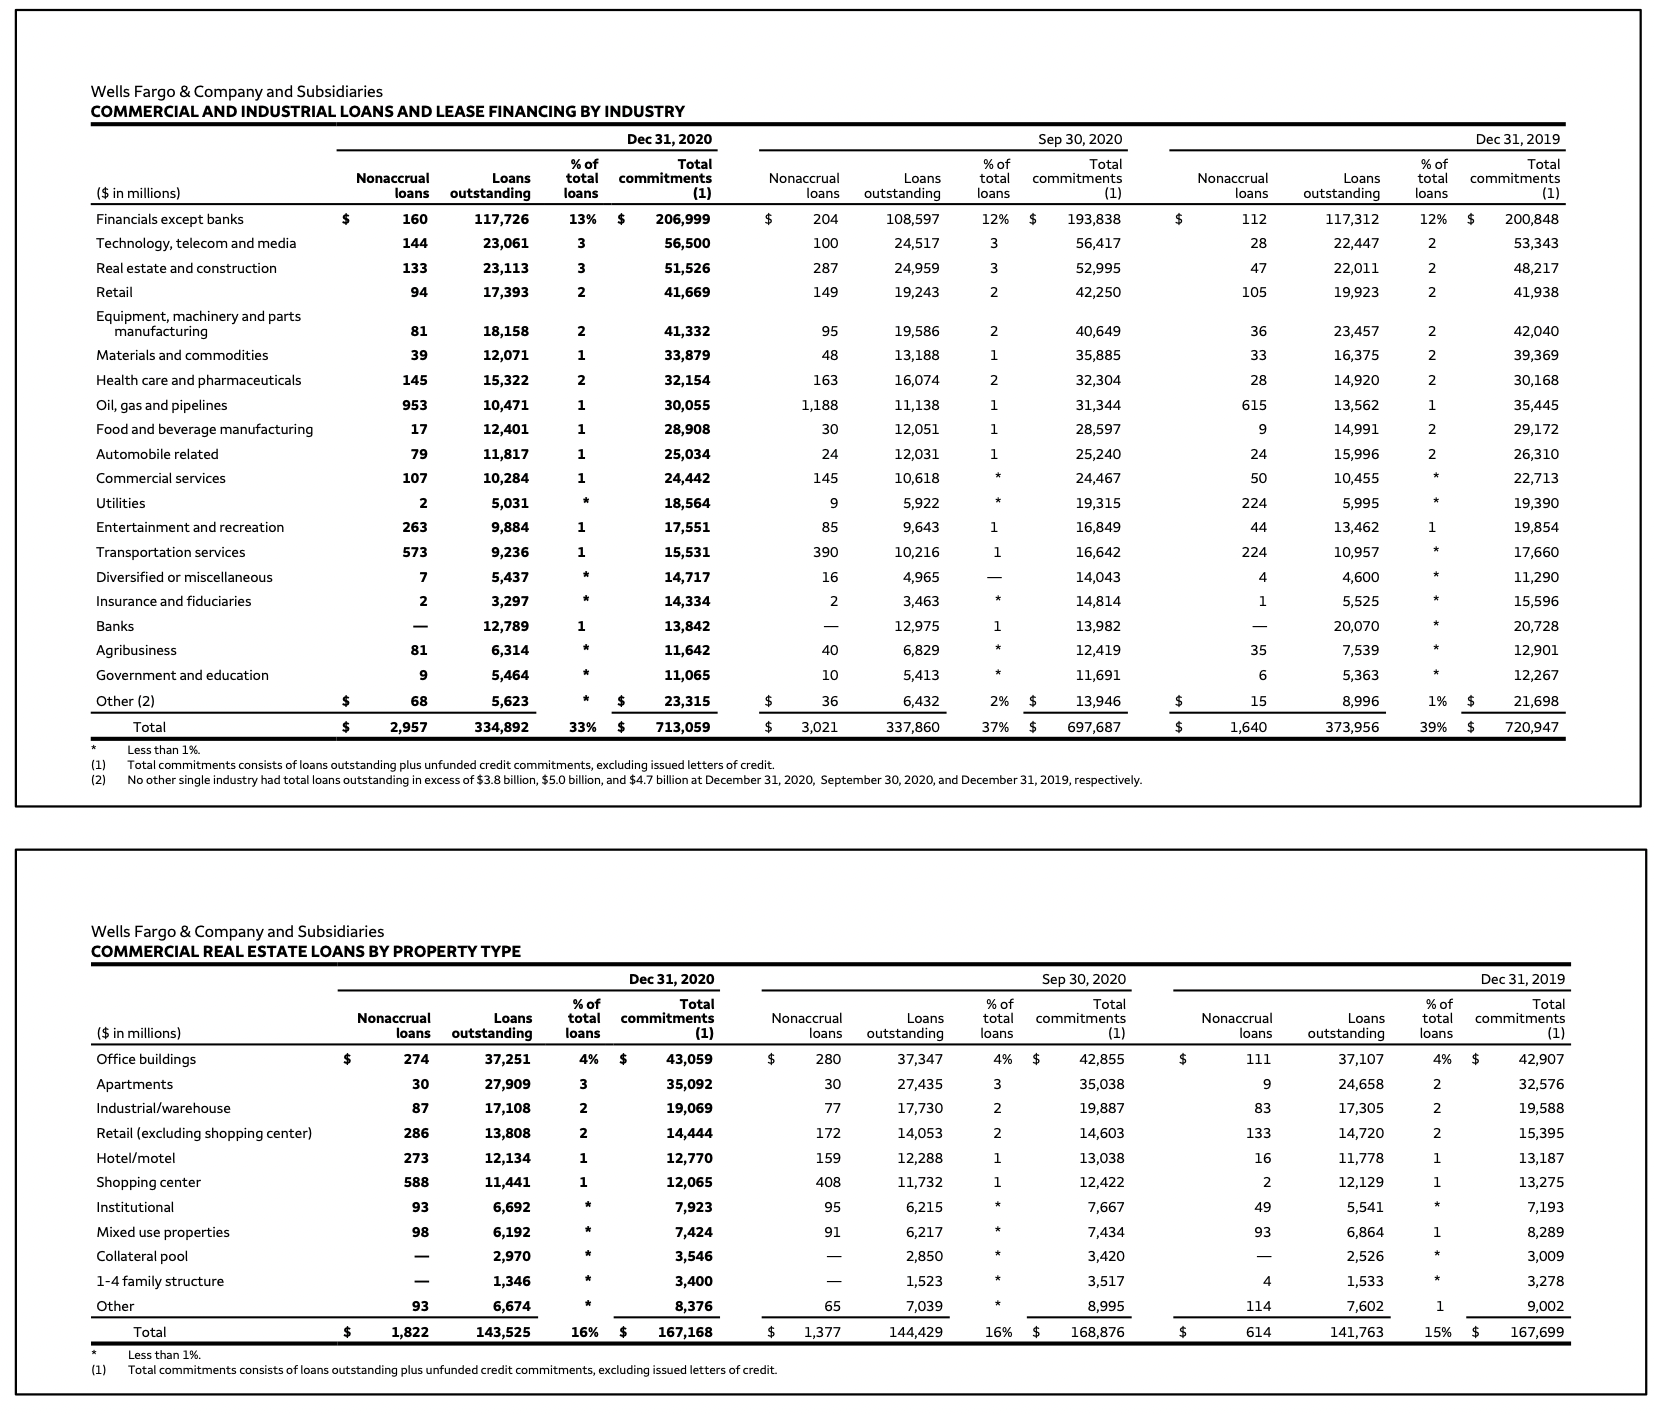
The following graphics (supplement pages 21 and 22) provide industry-specific information about troubled loans in Wells’ C&I and CRE portfolios but do not explain changes in the ALLL – nonaccrual loans now are almost identical to 12/19 levels when the ALLL was 31% and 22% of its current level. Clearly, banks are not moving loans to nonaccrual – perhaps because deferrals and loan modifications are enough to keep these loans current for the time being.
Deferral Activity
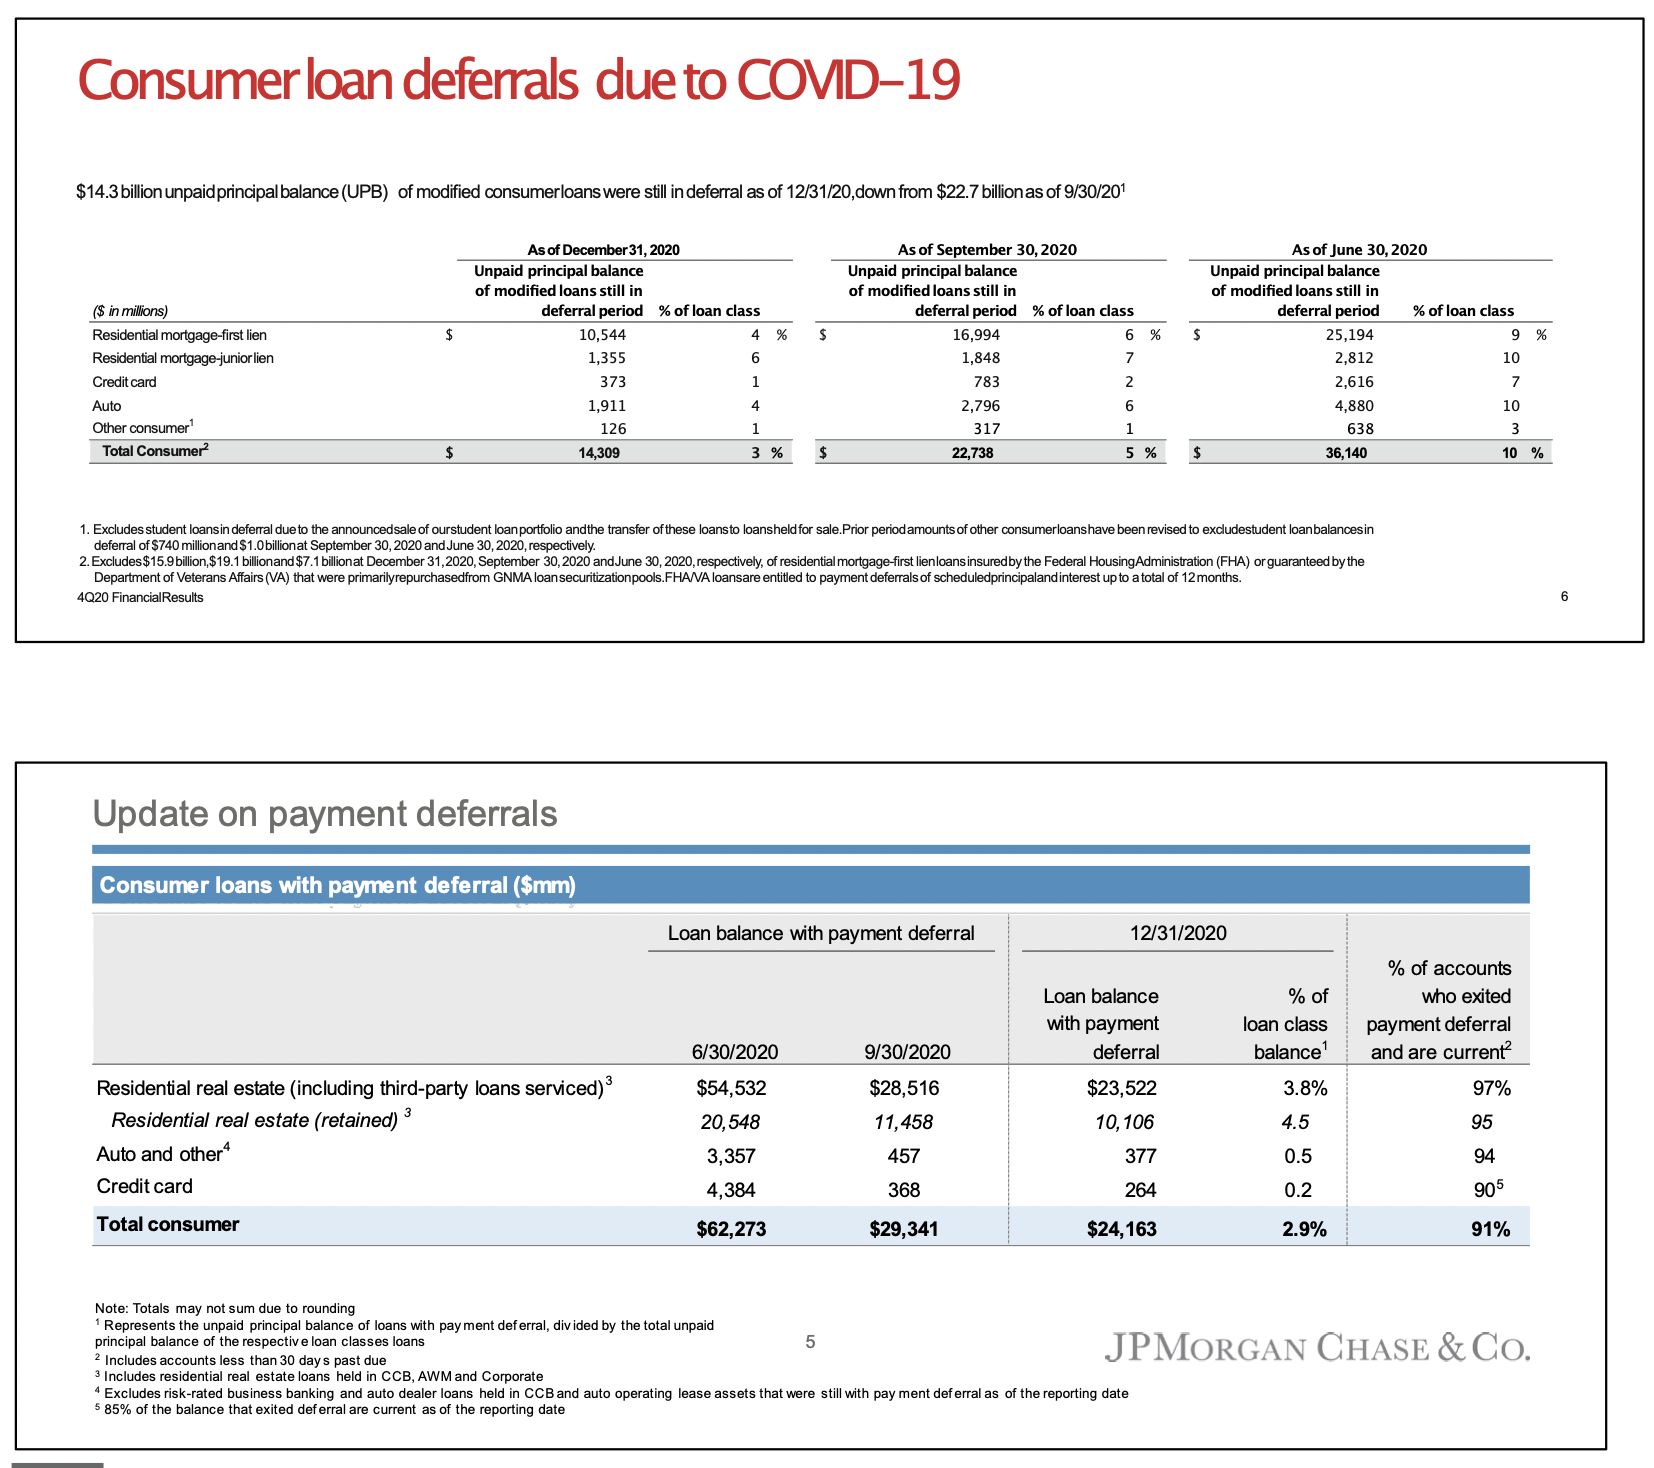
Analysis of deferral activity is the best way to predict potential losses. Unfortunately, most banks provide limited disclosure about deferrals. Both Wells and Chase provide deferral information only on their consumer portfolio as shown in the graphics below. For both, residential loans still in deferral amount to only 4% of their portfolios. Credit card deferrals are de minimis – 1% for Wells and 0.2% for Chase – down from June highs of 7% and 3%, respectively. More to point, Chase discloses the performance of loans that have exited deferral (likely with payments added to principal balance – not paid in full and not forgiven); 97% of mortgages are now current as are 90% of credit card accounts (85% by balance). It appears that deferrals are no longer masking credit risk. Unfortunately, modifications are not reported now – that’s where heightened credit risk is hidden.
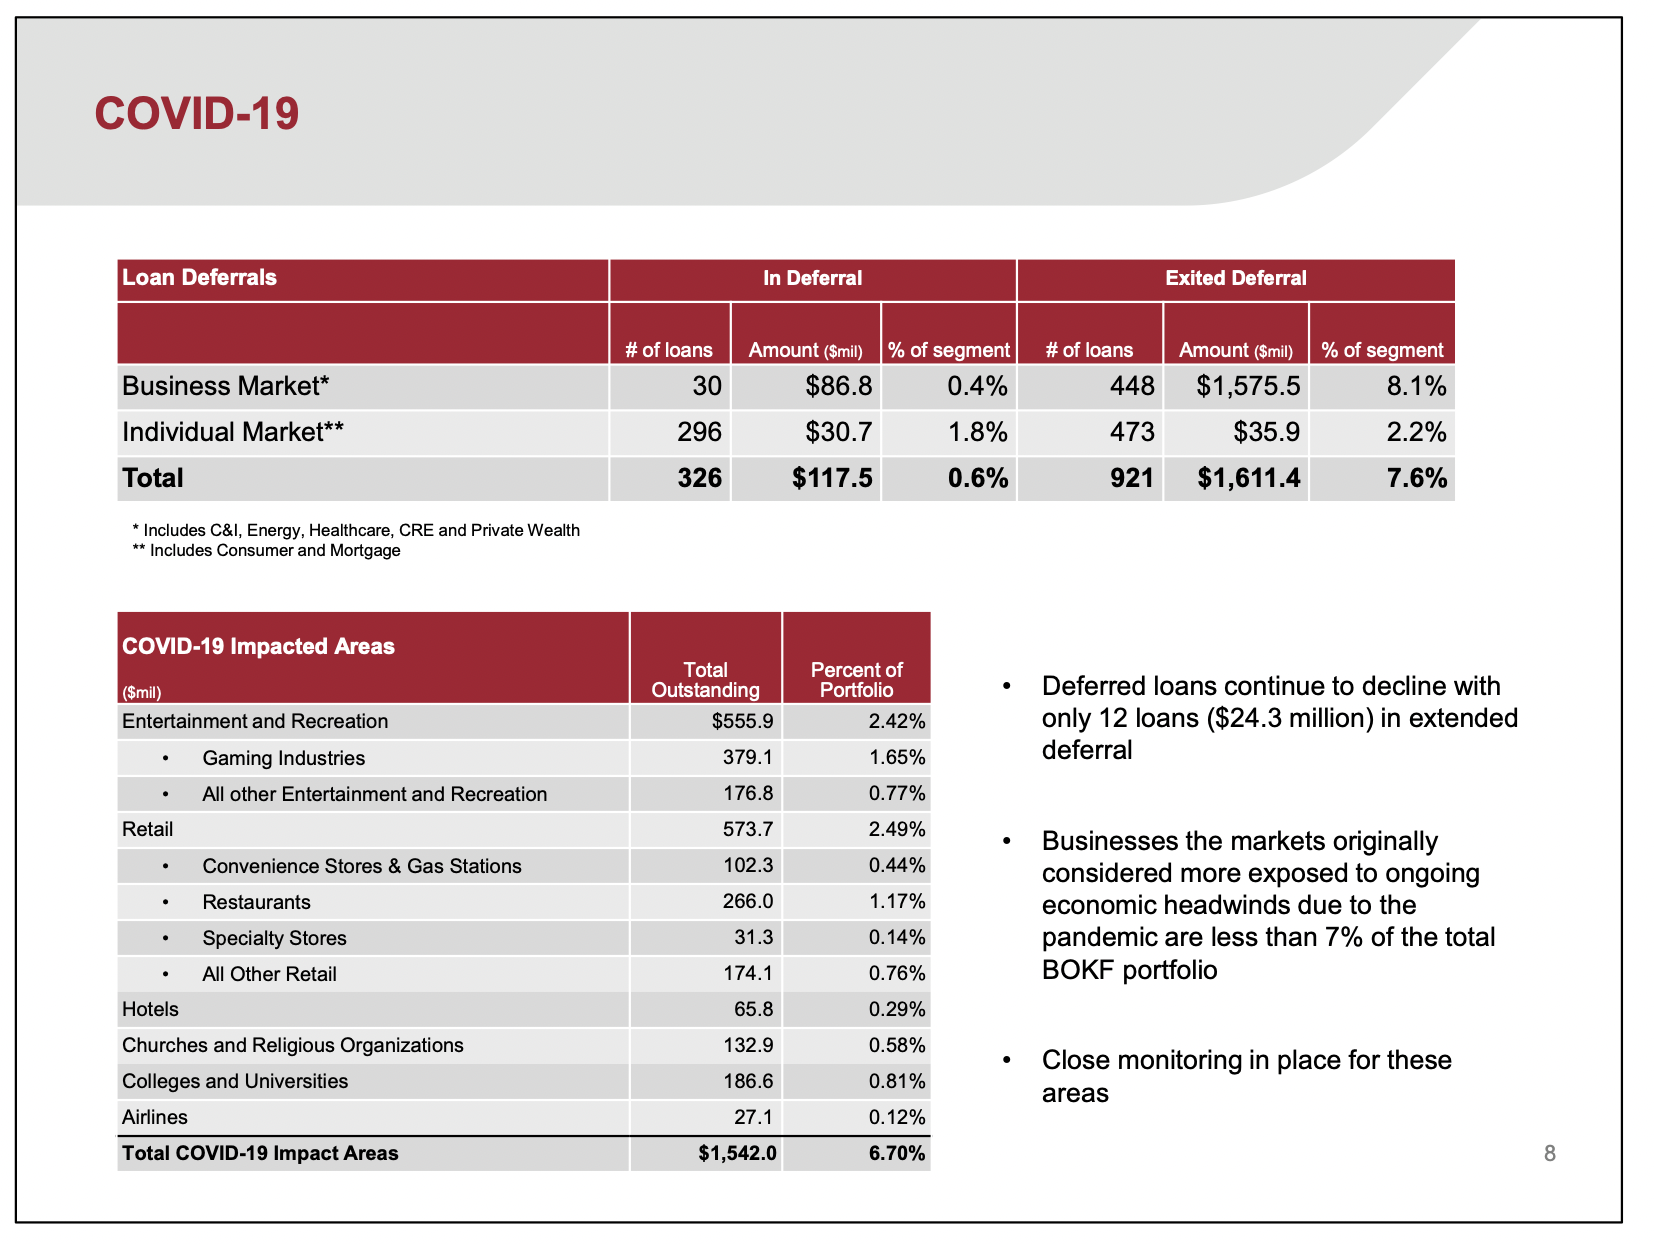
Deferrals have also been used to manage commercial loans. While none of the mega-banks provide information about commercial loan deferrals, some smaller banks provide insight into market norms. For example, Bank of Oklahoma provides data on consumer and commercial deferrals. It has a lower amount of deferrals than Chase and Wells (1.8%, likely mostly mortgage, versus 4% on mortgage and 3% overall), but only 0.4% of commercial loans are in deferral. As tough economic conditions continue, it will be interesting to watch for deferrals or refinancings of C&I and CRE loans that would normally be classified as troubled debt restructurings. Exiting a deferral with a modification simply pushes the credit risk into the future.
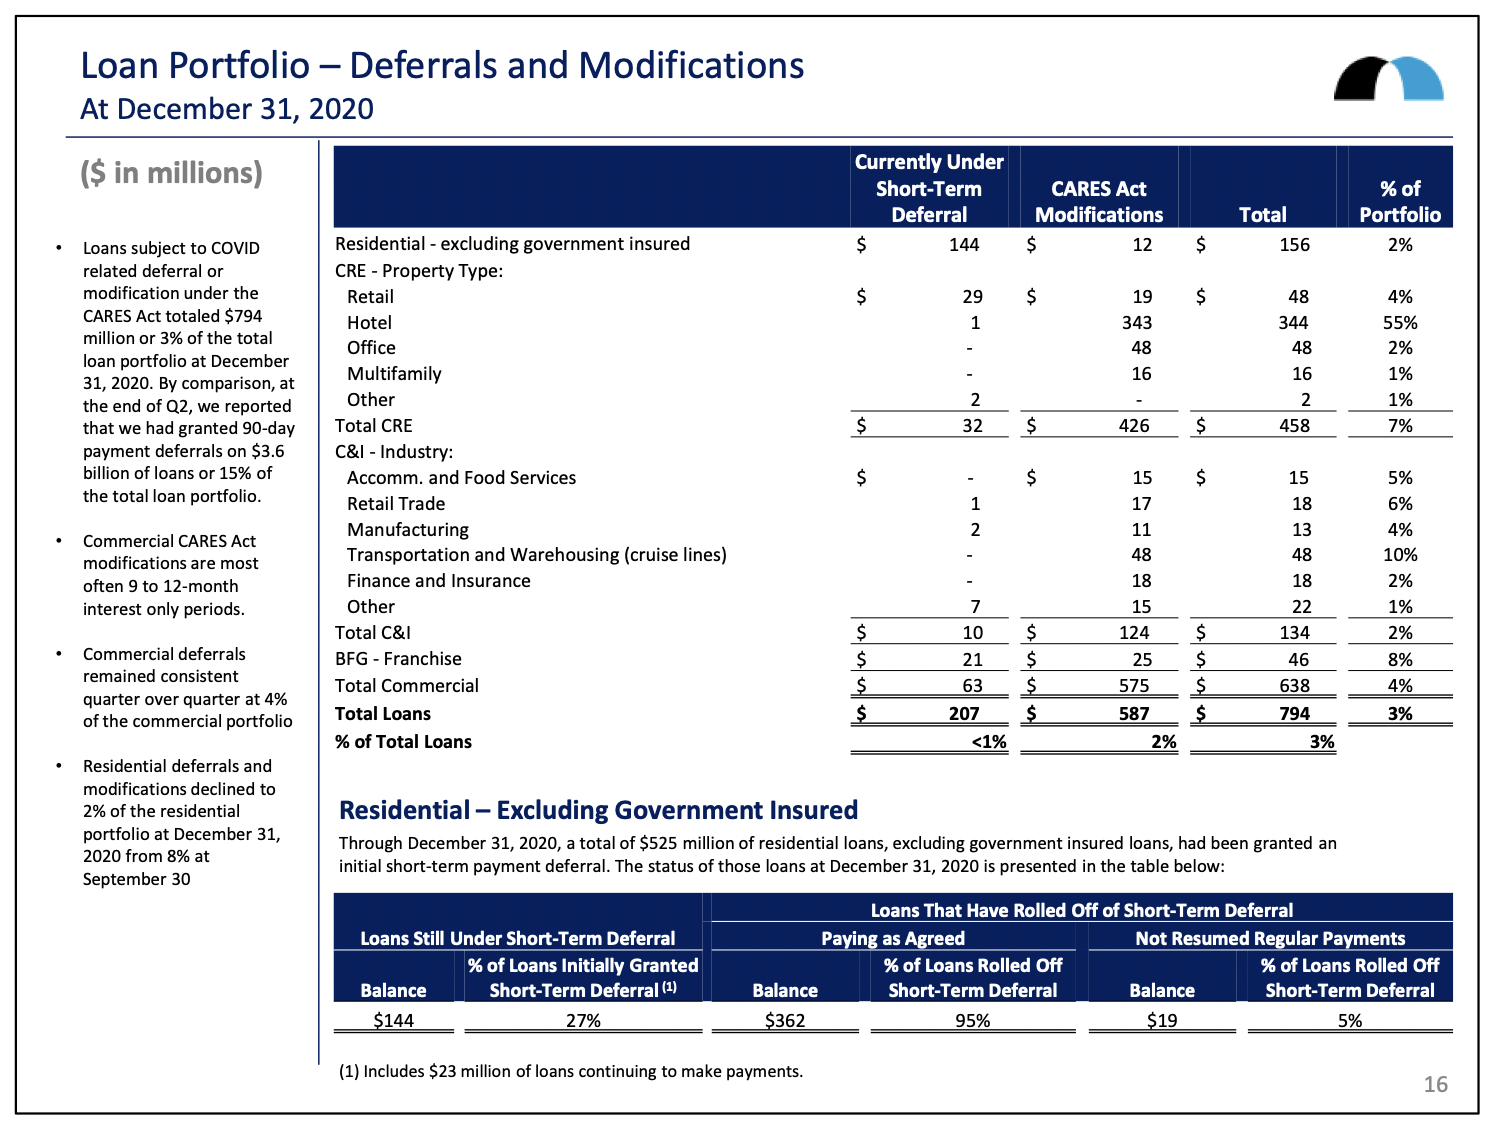
Instead of deferrals, some banks have modified loans under the CARES Act. Like BOK, BankUnited provides more granular data on deferrals, but it also provides data on CARES Act modifications by industry segment within the CRE and C&I space. For example, the graphic on the next page shows that a majority (55%) of its hotel loans were modified pursuant to the CARES Act; at $344 million this constitutes about 5% of BankUnited’s CRE portfolio. BankUnited’s actions are commonplace in the current bank environment – the difference is that they have reported it.
Summary
The biggest take-away’s from this quarter’s earnings releases are that digital banking is here to stay. Community banks must develop and execute a digital strategy or risk losing customer relevance. Changes in fee income by type demonstrate that changing payment patterns are already having a material impact on the bottom line.
The second key issue is credit performance during the pandemic. Banks took unusually large provisions in 1Q and 2Q 2020 only to reverse some of that in the fourth quarter. Analysis of deferral activity would suggest that there have not been material changes to the credit quality of portfolios. That said, CARES Act modifications and other borrower-friendly initiatives may be masking performance, making it impossible to determine true expected losses. As a result, it is not yet possible to assess credit damage in bank portfolios.
Sources:
http://investor.bankofamerica.com/index.php/financial-information/quarterly-earnings
https://www.citigroup.com/citi/investor/pres.htm
https://www.jpmorganchase.com/ir/events
https://www.wellsfargo.com/about/investor-relations/quarterly-earnings/
Disclaimer
This presentation is being furnished on a confidential basis to provide preliminary summary information. The information, tools and material (collectively, information) contained herein is not directed to or intended for distribution or use by any person or entity who is a citizen or resident of or located in any jurisdiction where such distribution, publication, availability or use would be contrary to law or regulation or which would subject Endurance Advisory Partners, LLC, to any registration or licensing requirement within such jurisdiction.
The information presented herein is provided for informational purposes only and is not to be used or considered as an offer to sell, or buy securities or other financial instruments, or any advice or recommendation with respect to such securities or other financial instruments. The information may not be reproduced in whole or in part or otherwise made available without the prior written consent of Endurance Advisory Partners, LLC. Information and opinions presented have been obtained or derived from sources believed to be reliable, but Endurance Advisory Partners, LLC makes no representation as to their accuracy or completeness. Endurance Advisory Partners, LLC, accepts no liability for any loss arising from the use of the information contained herein.
This information is subject to periodic update and revision. Materials should only be considered current as of the date of the initial publication, without regard to the date on which you may access the information. Endurance Advisory Partners, LLC, maintains the right to delete or modify the information without prior notice.
Under no circumstances and under no theory of law, tort, contract, strict liability or otherwise, shall Endurance Advisory Partners, LLC be liable to anyone for any damages resulting from access or use of, or inability to access or use, this information regardless of whether they are dire, indirect, special, incidental, or consequential damages of any character, including damages for trading losses or lost profits, or for any claim or demand by any third party, even if Endurance Advisory Partners, LLC knew or had reason to know of the possibility of such damages, claim or demand.